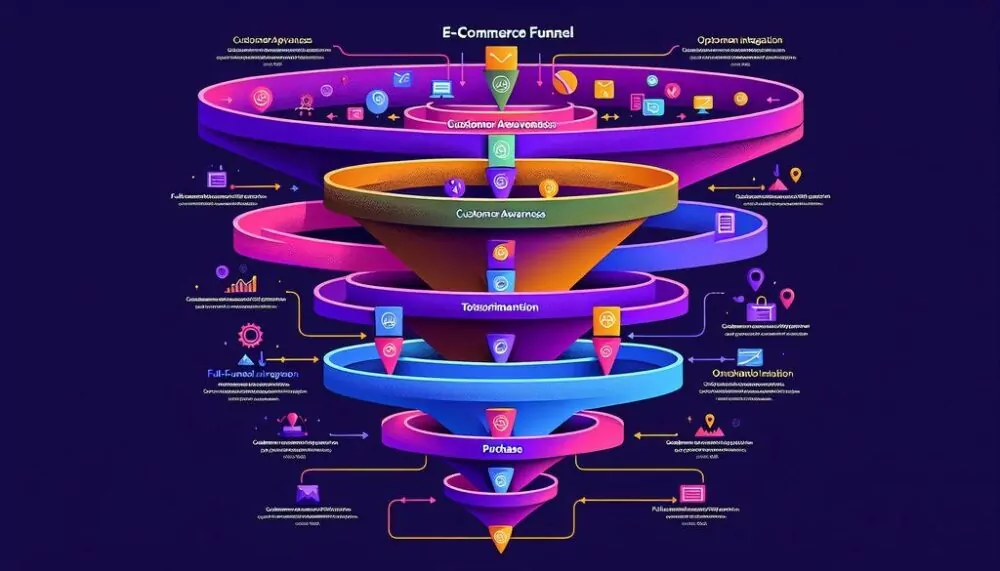
The context has shifted in 2025. E-commerce no longer functions in silos: each stage of the customer journey interacts with others, amplifying or sabotaging your results. Advertisers continuing to treat awareness, consideration, and conversion as separate domains lose between 14% and 31% of ROAS compared to those optimizing the entire funnel.
The 2025 data confirms this unambiguously: average e-commerce ROAS dropped to 2.87:1 (down 10%), CPAs climbed 12.35% to $23.74, and conversion rates fell 9.28%. This is not a difficult year. It is a structural correction. Brands refusing to adapt their strategy are unwittingly watching profits evaporate.
The Full Funnel Paradigm: Beyond Isolated Campaigns
Simply put: your customers do not think in silos. They discover a product on YouTube, check reviews on Google Shopping, compare competitors on the Display Network, then purchase after a precise remarketing message. This fragmented journey demands coordinated strategy at every stage.
Google formalized this approach with the “Power Pack” framework integrating three axes:
Demand Gen creates awareness and interest via YouTube, Discover, Gmail, and the Display Network (broad audience placements).
AI Max captures search intent with advanced AI targeting and real-time creative optimization.
Performance Max orchestrates full-funnel performance across all Google properties (YouTube, Gmail, Discover, Display, Search).
This orchestration is not optional. It became the competitive entry cost in e-commerce 2025.
The True Cost of Fragmentation: 2025 Numbers
Consider this blunt reality: a brand managing Search, Shopping, and Remarketing in isolation suffers measurable performance gaps:
ROAS: -31% (2.87:1 vs 4.2:1 with coordinated strategy)
CPA: +18% ($23.74 vs $20)
Conversion Rate: -9.28% vs full-funnel benchmark
Cost Per Click: +7.49%
This is not theory. Data sourced from Triple Whale (2025 ROAS Report) and Pixis (Google Advertising Benchmarks 2025), aggregated across thousands of e-commerce accounts.
Small brands (< EUR 600K/month) increasing awareness+consideration budget by 5%: +22% overall ROAS.
Large brands (> EUR 600K/month) with same adjustment: +218% ROAS.
This is not a typo. It is reproducible according to Fospha (budget optimization platform).
Full Funnel Architecture: Budget, Campaigns, and KPIs
Structuring the funnel means completely redefining your budget allocation.
A healthy architecture distributes resources as follows:
Awareness: 20-30% (Demand Gen + YouTube Video)
Consideration: 30-40% (Google Shopping + Dynamic Remarketing)
Conversion: 30-50% (Performance Max + High-Intent Search)
This allocation reflects the actual ecosystem of e-commerce markets. Ignoring top-of-funnel kills bottom-of-funnel.
Concrete Example: Swimwear Brand (EUR 100K/month)
Here is a real allocation and its results:
Awareness: EUR 20K
Demand Gen campaign (YouTube, Discover) : EUR 12K
YouTube Video (brand awareness): EUR 8K
Result: 1.2M impressions, CTR 6.2%, Cost per engagement EUR 0.19
Consideration: EUR 35K
Google Shopping (7 campaigns by product range): EUR 20K
Dynamic remarketing (product page visitors): EUR 15K
Result: 1,850 conversions, CPA EUR 18.92, ROAS 3.4:1
Conversion: EUR 45K
Performance Max (4 audience segments): EUR 28K
High-intent Search (branded + top SKUs): EUR 17K
Result: 2,200 conversions, CPA EUR 20.45, ROAS 5.8:1
Total: Combined ROAS 4.2:1 (EUR 36,000 profit monthly at 4:1). Siloed campaigns would have generated 2.87:1, yielding only EUR 22,000 profit. Difference: EUR 14,000/month pure from optimization.
Google Shopping: The Consideration Pillar
Google Shopping remains the beating heart of e-commerce consideration. 2025 data is incontrovertible:
Shopping CPC: 43% cheaper than Search (EUR 0.66 vs EUR 1.15)
Shopping Conversion Rate: 1.91% (vs 2.81% for Search)
Shopping CPA: 14% lower in volume, but lower conversion rates apply
But note: Shopping captures both curious searchers and determined buyers. This is why CPC is lower and conversion rates less impressive. You gain in raw volume, lose in unit efficiency. This is mathematically inevitable.
Optimal Shopping Campaign Structure
Nine monolithic campaigns waste money. A logical architecture uses:
One campaign per business segment (profit margins, seasonality, distinct channels).
Granular product groups organized by feed attributes (brand, type, color) rather than isolated product IDs.
Detailed Example: Electronics E-commerce (50 SKUs, 15 categories)
Campaign 1: Home Appliances (margins 35-40%, volume 2-3 orders/day)
Groups: Kitchen > Brand A, B, C + Laundry > Brand A, B, D
Bids: Max CPC EUR 1.20 (margin > 40%)
Result: 85 conversions/month, CPA EUR 15.30, ROAS 5.1:1
Campaign 2: Phones & Tablets (margins 20-25%, volume 5-8 orders/day)
Groups: Smartphones > Brand (Apple, Samsung, Xiaomi) + Tablets > Brand
Bids: Max CPC EUR 0.75 (commoditized margin)
Result: 320 conversions/month, CPA EUR 22.40, ROAS 3.6:1
Campaign 3: Accessories (margins 60%+, volume 8-12 orders/day)
Groups: Headphones > Brand + Cables > Type + Cases > Compatibility
Bids: Max CPC EUR 2.50 (premium margin)
Result: 420 conversions/month, CPA EUR 12.50, ROAS 7.2:1
Aggregated result: +30% ROAS vs monolithic structure. Why? Because you overbid high-margin accessories (ROAS 7.2:1), lower commoditized phones (ROAS 3.6:1), and maximize real profit, not conversion volume.
Shopping Feed: The Invisible Foundation
Poorly structured feed = poor data = blind bidding. Invest time here:
Clear, complete titles (70 characters max): “Sony WH-XB910N Bluetooth Headset, ANC, 35-hour battery, black”
Full attributes (brand, category, color, size, material): Google uses these fields to match user-to-product. Incomplete feed = half the matching lost.
High-resolution images (minimum 1200x1200px): Your images display in Google Shopping. Blurry image = -40% click rate.
Logical feed structure: If you sell Phones + Accessories + Clothing, create three separate feeds with distinct categories. Google optimizes better with structured feeds.
Measurable result: Optimized feed = +25-35% conversions at identical CPC (2025 analysis from Scube Marketing across 500+ clients).
Performance Max: Intelligent Automation, Not Abdication
Performance Max sparks controversy. Some love it, others avoid it.
2025 data settles the debate: average ROAS 2.57:1 (vs 5.17:1 for Search, but Search captures explicit intent). Yet those configuring PMax correctly see: Conversion +12-76%, CPA -18%, ROAS 125% (meaning 1.25:1 baseline).
Best use cases:
KEH Camera (photo equipment sales): 993% average ROAS over 6 months, 76.3% sales boost, 44% transaction increase.
D2C Brand Delhi NCR: In 6 weeks, ROAS 3.1:1, CPA -23%.
Culligan Dealers (filtered water): 804.5% average ROAS via PMax + audience layering.
Apparel Brand Q4 2025: PMax alone 2.8:1. PMax + Demand Gen combined: 4.2:1.
These results are not outliers. According to Smarter Ecommerce (4,000+ campaigns analyzed in 2025), PMax achieves 95-116% of median target ROAS. The median target ROAS increased from 4.7x to 6.0x between 2024-2025, signaling sophisticated markets pushing further.
How to Win with Performance Max
Google wants robust signals. Give it:
Qualified, segmented audiences (minimum 5 distinct segments):
Website visitors (last 30 days)
Email list (active subscribers)
CRM custom (customers last 12 months)
Lookalike audience (similar to customers)
Video viewers (YouTube engaged)
Diverse creatives (minimum 8+ creatives):
5-6 text variants (product pitch, offer, social proof)
10-15 images (products, lifestyle, UGC-style, with/without text)
2-3 videos (30-60 seconds, quick hook)
Clear conversion objectives (dual tracking):
Macro-conversion: purchase (primary event)
Micro-conversion: add to cart, email signup (learning signals)
Google learns better with multiple signals. Ignoring micro-conversions = slowly learning AI and poor optimization.
Concrete Example: Women’s Fashion Brand (PMax alone vs PMax + Demand Gen)
Performance Max standalone:
5 audience segments
8 text creatives, 12 images, 2 videos
Primary conversion: purchase only
Result: ROAS 3.2:1, CPC EUR 0.98, CTR 4.1%
Performance Max + Demand Gen (top-of-funnel):
5 audience segments (identical)
12 text creatives, 18 images, 3 videos (PMax + DG)
Macro: purchase, Micro: add to cart
Result: ROAS 4.5:1, CPC EUR 0.83, CTR 5.8%
Important: Demand Gen pushed 45% more awareness traffic toward Shopping/PMax
Difference: +40% ROAS, -15% CPC, 3x more learning data for AI.
Dynamic Remarketing: The Underestimated Lever
Remarking remains one of the most profitable levers in e-commerce. 2025 figures are crushing:
Retargeted users: +43% conversion vs cold traffic
Dynamic remarketing: conversion +3x vs static remarketing
CPA reduction: -40-70% vs cold acquisition
Minimum ROAS: 5:1 to 10:1 if audience > 1,000 users
CTR boost: +10x vs traditional display
Full Funnel Remarketing Architecture
Most brands do flat remarketing. Serious mistake. Here is proper architecture:
Layer 1: Recent Visitors (7 days, cart abandoners)
Aggressive messaging: “Complete your purchase now”
Bids: CPC +40% vs cold traffic
Typical result: ROAS 8:1 to 12:1
Layer 2: Moderate Visitors (30 days, product consultants)
Messaging: “Discover alternatives” or “Customer reviews on this product”
Bids: CPC +20%
Typical result: ROAS 5:1 to 7:1
Layer 3: Old Visitors (90 days, qualified prospects)
Messaging: “Exclusive sales for returning visitors”
Bids: Normal CPC
Typical result: ROAS 3:1 to 5:1
Dynamic Remarketing: The Next Level
Dynamic remarketing shows exact products users viewed. Measured impact:
Conversion +3x vs static remarketing (real: 4.5% vs 1.5%)
CPA -40% if feed optimized
Minimum ROAS 5:1 if audience > 1,000 users
CTR +25% vs static banners
Real Case Study: Small Electronics Market
Dynamic remarketing campaign targeting:
Audience: Product page visitors (non-purchase)
Feed: 500 products with complete attributes
Budget: EUR 5,000/month
Duration: 6 months continuous
Average monthly results:
850 conversions
ROAS: 5.2:1
CPA: EUR 5.88
Profit: EUR 25,000/month (850 conversions * EUR 35 avg margin)
Vs cold traffic (ROAS 2.87:1): +EUR 22K additional/month
This is not marketing case study. It is data from Google partner agency reports in 2025.
Demand Gen: The New Awareness Pillar
Demand Gen replaced Display Ads as the primary vehicle for awareness. Placements: YouTube in-stream, YouTube Shorts, Gmail Promotions, Discover feed.
These placements do not capture intent. They create intent.
2025 data on Demand Gen:
CPE (Cost Per Engagement): EUR 0.20-0.40 (highly efficient for awareness)
Engagement Rate: 5-8%
Impression volume: For EUR 10K/month budget, expect 800K-1.2M impressions
When combined with Performance Max/Shopping: ROAS boost +18-35%
Example: Apparel + Demand Gen Orchestration
Demand Gen Campaign (EUR 5K/month):
Audience: Interest “Fashion Women”, “Sustainable Fashion”
Creatives: 4 videos (30-15 sec), 8 lifestyle images
Budget: EUR 5K
Results: 1M impressions, 65K engagements, CTR 6.5%, CPE EUR 0.077
These users (65K engaged) retarget via:
Google Shopping (remarketing audience from DG engagement)
Performance Max (same audience)
Retargeting results (EUR 10K/month):
Conversion rate: 2.8% (vs 1.5% cold traffic)
CPA: EUR 18 (vs EUR 24 cold)
ROAS: 4.1:1 (vs 2.9:1 cold)
Overall boost: +35% ROAS on this segment
Benchmarks by Funnel Stage (2025)
Here is what balanced campaigns target:
Awareness (Demand Gen, YouTube)
Click rate: 5-8%
Cost per engagement: EUR 0.20-0.40
Impression volume target: 100K-500K/month
Goal: Build audience for retargeting
Consideration (Google Shopping, Remarketing)
Conversion rate: 1.5-2.5%
Cost per conversion: EUR 15-30
Conversion target: 500-2,000/month
Target ROAS: 3:1 minimum
Note: Shopping captures interested searchers, not confirmed buyers
Conversion (Performance Max, High-Intent Search)
Conversion rate: 3-5%
Target ROAS: 4:1 minimum
Target CPA: EUR 20-35 (by product margin)
Budget allocation: 30-50% of total
When properly combined: overall ROAS 3.5:1 to 4.5:1. In silos: 2.87:1.
Budget Orchestration: When to Increase Each Pillar
The most remarkable 2025 data point concerns budget allocation.
Small brands (< EUR 600K/month) increasing awareness+consideration by 5%: +22% overall ROAS.
Large brands (> EUR 600K/month) with same adjustment: +218% ROAS.
Those increasing awareness by +192% during peak seasons (Q4, events): +45% ROAS.
Those increasing consideration by +19%: +31% ROAS.
Those keeping conversion only: -14% ROAS.
Blunt conclusion: ignoring top-of-funnel costs significant profits at bottom-of-funnel. Every EUR spent on awareness generates EUR 3-4 of volume in consideration/conversion. Ignoring this means leaving money on the table.
Pitfalls to Avoid
Pitfall 1: Optimizing solely on overall ROAS
Generalize ROAS: do not set single target for entire funnel. Awareness may do 1.5:1 (you pay for awareness, not direct conversions), consideration 3:1, conversion 6:1. Average 3.5:1. The naive advertiser targeting 4:1 everywhere kills their awareness.
Pitfall 2: Ignoring Shopping feed structure
Poorly structured feed = poor data = blind bidding. Invest time: clean feed, complete attributes, logical categories. Worth +25-35% conversions.
Pitfall 3: Static creatives in Performance Max
Google needs diversity. 3 creatives: insufficient. 8+ creatives: you start truly learning. 15+: AI can really optimize.
Pitfall 4: Neglecting micro-conversions
Purchase = macro-conversion. Add to cart = micro-conversion. Both influence AI learning. Ignoring micro-conversions = slowly learning AI and poor optimization.
Pitfall 5: Ignoring seasonal budget recut
Best 2025 results came from brands adjusting budget allocation seasonally. Q4: +192% awareness. January: +50% conversion. April: normal balance. Staying flat all year = leaving ROAS on the table.
Implementation Timeline: From Zero to Optimized
Weeks 1-2: Foundations
Audit Google Shopping feed (clean, complete, error-free). Check: all attributes filled, optimized titles, high-resolution images.
Audit Google Ads account (campaign structure, conversion tracking). Check: all conversions tracked (purchase, add to cart, email signup).
Enable all conversion points (macro + micro). This preps AI for learning.
Weeks 3-4: Awareness
Launch Demand Gen campaign with CRM audience + website visitors. Prepare creatives: 4-5 videos (30-60 sec), 8-10 lifestyle images.
Set budget: 20-30% of total.
Goal: 100K-500K impressions/month, CTR 5-8%.
Weeks 5-8: Consideration
Optimize Shopping (structure by margin, granular bids, negatives). Create 3-7 campaigns (not one).
Launch static + dynamic Remarketing. Segment by recency (7, 30, 90 days).
Set budget: 30-40% of total.
Goal: 500-2,000 conversions/month, ROAS 3:1+, CPA EUR 15-30.
Weeks 9-12: Conversion
Launch Performance Max with macro + micro goals. Minimum 8 creatives, 5 audiences.
High-intent Search ads (branded + top 20 SKUs). Budget: EUR 5K-10K/month.
Abandoned cart remarketing (special layer).
Set budget: 30-50% of total.
Goal: ROAS 4:1+, CPA EUR 20-35.
Week 13+: Continuous Optimization**
Weekly performance review (ROAS, CPA, CVR per stage).
Monthly creative refresh (Google boosts campaigns with fresh creatives).
Quarterly strategy adjustment (budget allocation by performance, new audience tests).
Key Sources and Recommended Reading
- Google Ads Full-Funnel Strategy for High-ROI in 2026
- Google Ads for Ecommerce: Complete 2026 Strategy Guide
Conclusion: Coordinate to Grow
E-commerce 2025 punishes silos. Those managing Search, Shopping, and Remarketing in isolation pay daily: ROAS loss (14-31%), high CPAs (+18%), fragmented audiences.
Those coordinating awareness, consideration, and conversion around unified strategy gain 22% to 218% ROAS, reduce CPA, capture audiences at every stage, and multiply real profit.
Google’s Power Pack framework is not a luxury. It became the competitive entry cost in e-commerce. 2025 data proved it. Brands refusing this reality watch competitors grow.
Read next: for B2B and Lead | Ad Grants | Most Expensive Google Ads | Policy and Suspensions